Climate Destruction - America
More statistics on global climate change are now freely available of which are showing a colossal amount of carnage that is hitting America both structurally, and economically from which we thought the previous data going back to 1980 would have been taken seriously by presidential leaders past to present to businesses and power plantations pumping out harmful chemicals in to the air we breathe.
America is not the only country though that is to be blamed here, however with substantial proof and now clear precise data both damaging and monetary to the Americans pocket, International Animal Rescue Foundation would have thought that more would have been done to decrease this vast change to trend to placing now harsher laws and strict company penalties that would see those punished that cause climate damage should one not meet governmental standards.
What do we do though? The people’s president Barack Obama is running the country why when presented with data of which we hope he has, has not made some form of public statement in his next run up for election. Are the statistics alarming, well I could think of more words to describe but that would be straying?
From 1980 to 1985 there was in total three tornadoes between February and June, June to October saw two vast hurricanes, onwards from this the best part of December saw blizzards and ice storms. A total of $56 billion of damage caused in drought/heat waves caused to June and September.
From 1985 to 1990 there were a total of two blizzards and ice storms between January and February, but hardly any weather patterns from February up to August that saw a substantial heat wave and again drought the worst between 1988-89 causing a catastrophic $78 billion in damage, the lesser of that heat wave/drought was in 1986. From the start of September than saw three hurricanes causing substantial damage and loss of life in 1985. The worst hurricanes in between this period were 1989. No major ice or snow extremities in weather where recorded as a “matter of concern” from the period of 1985 to 1990. Although there was a humongous increase in heat/drought damage why did the president of the states not take action to halt this via reducing greenhouse emissions? This is the million dollar question, because if one knows that “global warming is happening” then to stop the then “climate change” more has to be done and although one cannot place blame just on the government, the government ARE the leaders that can and MUST lay down the laws. With elections nearing then why have these figures not been addressed. The climate change events are not going to get any better just more extreme causing not millions or millions but eventually trillions in damage. International Animal Rescue Foundation is trying to now help the general public via teaching people how to now adapt and not just batten down the hatchets. Adaption, Better Living, Control, (ABC) this I shall go in to more detail on along with the three R’s Reduce, Reuse, Recycle on other documents via our climate research.
From 1990 to 1995 sees weather patterns fluctuating to extreme events with concerns from climatologists to environmentalists’ of weather change being raised as of highly unpredictable climate change, destruction and death. The first year of 1990 saw small-scale tornadoes in between May and June, the start of July saw small scaled wild fires from the whole of October to November though in 1990 saw nothing but ice and blizzard storms plunging America in to a big freeze. 1991 saw one recorded disaster between March and April, with hurricanes between June and July, then from October to November which we even find odd for that pattern saw a massive degree of wildfires hit in between that period. So ok 1991 really did not see any major weather patterns but this was the start of the big climate change that could have been reduced had American leaders done more, there was a total of 26 weather events causing billions of dollars in damage displacing people, destroying homes, businesses, schools and hospitals, ripping apart communities with death toll not even recorded. One wildfire was recorded in 1991 causing just under $5 billion of damage.
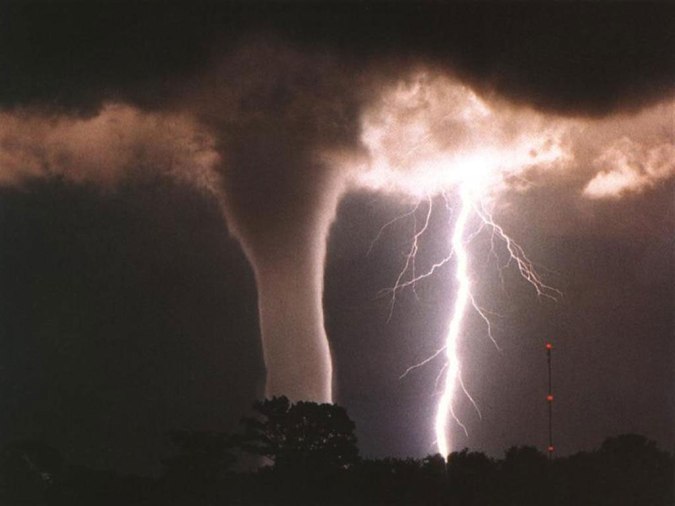
1992 though did see the start of what we call now as “climate change” and not global warming. 1992 saw six destructive weather patterns hit the United States of America (USA) in between March and April tornadoes were recorded and then just after the after the start of April more tornadoes were recorded.
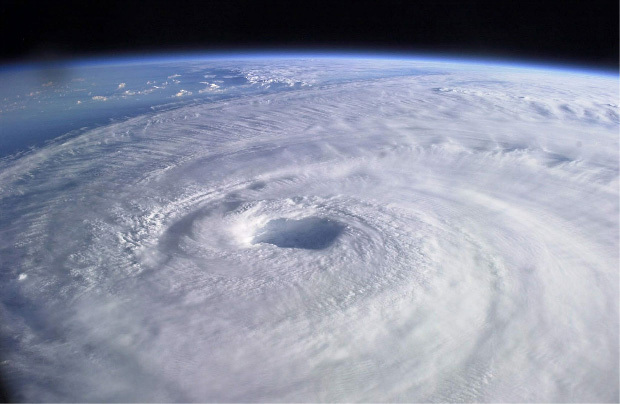
There was no brief break in the weather then from May to June and then just after June another wildfire was recorded. Then in 1992 we saw the beginning of what we call “the big ones” Catastrophic hurricanes of which two was recorded in the space of just one month. The first one was Hurricane Andrew that caused an estimated $44 billion of damage with loss of life, and a mass hit on the economy recorded between August and September. Then shortly after that there was another hurricane recorded just after September moving in to October. Then there was a brief lull in the weather which then saw at the start of December roughly a blizzard/ice storm/big freeze that again caused major disruption to the economy and country.
Moving into 1993 again we didn’t see much disruption in the weather patterns over the United States of America however what we did see was a massive shift that was to take the country by surprise yet again causing billions in damage.
The freak winter weather though from December of 1992 did go all the way through to 1993 right up to March and April of which caused under $9 billion of damage to the state which the tax payer then had to pick up. This was the storm of the century that hit the eastern seaboard with extreme heavy snows and blizzards.
So from 1993 April again we saw a lull in the weather pattern, which really should have been noted and documented on ready for “the big ones” and these lulls are what we are seeing as a “pattern” in the climate. Sudden drops in weather with must be taken seriously but again this was ignored. Although one cannot predict such events occurring the proof and patterns are there for all to see to now show that these patterns are indicating extremes moving in, or as we call them “the calm before the storm”. July to August saw a massive flood hit the mid-west of America causing a massive $33 billion of damage.
The winter of 1993 was not so severe but in fact very warm with no recorded “disasters” to loss of life in fact the winter was a very normal and mild one to say to the least.
1994 saw again a lull although not so calm, between January and March there was 2 very large blizzards/ice storms to big freezes, again all gone unnoticed of which meteorologists’ had reported to the United States government. Between March and April another tornado was recorded which is common for that time of year. July saw another flood although small still labelled as a disaster, September end saw a wild-fire and another small flood.
1995 we saw four billion dollar climate disasters, and although small it was the start of the beginning of CLIMATE CHANGE as we know it today. So being brief, from between January to February there was on average of $2-4 billion of damage noted as “disaster” from May to June there was then just under $ 5-6 billion of damage caused from the end of September, moving through to October and November there was combined almost $10 billion of damage caused by hurricanes of which again was noted as natural disaster.
From 1980 – 1995 there was in total as recorded natural weather/climate disasters exactly forty-six astonishing disasters these disasters where all tallied up that caused a total of $339 billion of damage to the United States of America. (Please note that we have not included every single disaster)
Now one would off thought the past and present American leaders would have learned from this thus creating some form of weather protection, looked at what was causing such vast climate change and pushed more stringent measures to controls out reducing the carbon output that “some scientists” claim is not caused by climate change.
From looking at the data now presented to us and other environmentalists we can see that on average from 1980 to 1995 there was not much change in regards to winter and spring temperatures heating up. Although there was the drought in 1980 that did cause a whopping $56 billion in damage, in theory the average rise in temperature was not of a great concern but was noted as a changing climate factor which many nation leaders, scientists, climatologists, botanists, environmentalists’, meteorologists’, marine biologists to company chief executives and more attended many meetings to summits to address and talk over what could be done to prepare for a move from “global warming” to now CLIMATE CHANGE.
What these experts didn’t realise was that CLIMATE CHANGE was already upon mainly due to trying to gather the amount of damages back up that was in such a short period of time from these freak weather occurrences. Money had to be made meaning more chemicals, gasses and toxins pumped in to the air. To note to there was a vast increase in population that the government had to meet on demand. With population increase then one does not have to go in to any further detail really to explain, what is needed to keep up with that trend.
From 1980 what the government in the White House did not estimate that another forty-one severe but this time most lethal weather occurrences where to hit the United States of America causing a massive loss of life, to human displacement, home and business destruction, animal habitat loss, economic meltdown, and a states of emergency. In total there were 87 natural disasters that on some if not all occasions the government of the United States failed to warn its people on. The damage caused was gastronomical in effect of exactly $541 billion. The American government are still picking the pieces of this up, yet invading other people’s countries, and pushing monies in to other nations of which you the tax payer are paying towards.
I am going to plot this out in an easier way of which I hope you can understand. It’s most important that one reads and understands it as of the quickening but worrying trend weather change trends.
All sixteen years are published in a brief but short bullet point graph starting from the least damaging to the most destructive.
- 1996 – 4 disasters were recorded the least damaging was between January – February of which saw ice/blizzard/and snow storms hit. February – March saw floods, May – June saw a massive drought with an estimated damage of just under $5 billion, September – October saw mammoth hurricanes hit the states again causing just under $5 billion of damage.
- 1997 – 3 disasters of which were vast in size again, January to February saw horrendous floods with an estimated loss of just under $5 billion in revenue, then another small tornado noted though as “disaster” causing millions in carnage, April – May saw more floods than June to December a complete lull in the weather with average weather and no disasters documented.
- 1998 – 9 disasters of which rocked the states causing vast damage but still the calm before the real storm to come, blizzards were recorded between January and February, between April and June saw tornado’s hit the states which if combined caused a maximum of $5 billion in damage August to September saw droughts and hurricanes the drought being the worst that caused billions in damage. September to October saw billions more in damages caused by hurricanes. October to November saw small-scale but noted as disasters “floods” with December seeing a massive freeze with snow and hail storms.
- 1999 – 5 disasters, from January to February saw small-scale snow storms to blizzards with tornado’s present too. A long monthly lull in the weather then passed to then be wrecked with another tornado between May and June. August to September saw a small-scale drought followed by a catastrophic hurricane causing billions of unknown damages to the states. We estimate it to be between $5-9 billion at least from looking on the graph.
- 2000 – The only year that has been noted saw literally no weather events at all. Normal calm weather apart from one massive wildfire with drought in the same region in the middle of July.
- 2001 – 2 disasters, however again like 2000 very slim. One tornado that was by far extreme causing over $1 billion in damage between April and May along with one enormous and damaging flood causing on average from $5-9 billion of damage, human and animal displacement, a massive hit to the economy, plus death toll.
- 2002 – 3 disasters, from April to May tornadoes, then a lull in the weather that saw again wildfires and drought combined between September and October.
- 2003 – 5 disasters, now we are seeing the change in climate increase and fluctuate without warning that the United States Government should have been prepared for. Five events were recorded like above as all disasters. April to May and May to June saw small and vast tornado’s that hit the states causing massive damage and loss to human and animal life. July to August to saw a smaller tornado, then from September to October the states where hit with catastrophic hurricanes causing billions of dollars in damage. Only one wildfire was recorded between October and November although large was still put down to a disaster.
- 2004 – 5 multi devastating storm surges that wreaked havoc across the states, the smallest being in May to June of which was your normal tornado but then came the big surges in total four one after the other. From mid-July going right through to mid-October the United States of America was hit by four massive hurricanes of which caused an estimated total of $18-19 billion of damage, loss of life, displacement, and utter carnage. Hurricane Charley and Hurricane Ivan devastated the United States but this was just a warning of which again was primarily ignored by the president and his weather team of experts that should have seen in the next following year of 2005 Hurricane Katrina bearing down on them. Although no one can predict such a storm by looking at the data one should have known that there was to be a “big one” forming upon the horizon.
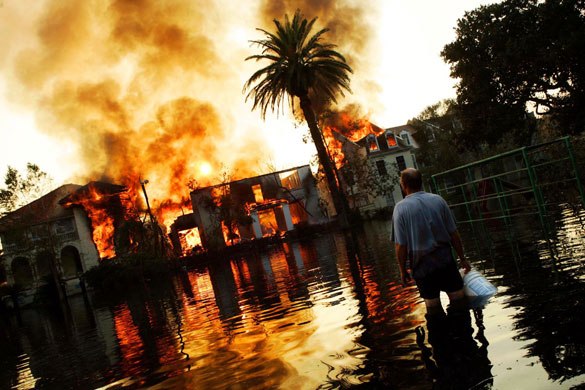
- 2005 – 5 major but most damaging storms to the United States that had ever been recorded in data that we and other experts know of. From January right through to June the United States saw no weather impact or recorded disasters. From mid-June though many “weather events “hit the United States causing billions upon billions of damage. Hurricane Katrina hit that was one hell of a storm causing catastrophic, devastating flood damage, wind surges, and massive loss of life displacing humans and causing a state of emergency of which the United States is still clearing up that they never was prepared for, for many factors from levies breaking, storm barriers giving way to lack of emergency shelter and planning. The storms that hit from mid-June to November where Hurricane Katrina, Hurricane Rita, and Hurricane Wilma the forth much smaller was downgraded to a tropical storm but still cased up to $1 billion of damage. Katrina caused $146 billion of damage Rita caused $19 billion of damage, and Wilma caused $19 billion of damage. A small but prominent drought caused around $ 1 billion although the full extent is not known from that drought that occurred at the start of July and finishing near August end.
- 2006 – 6 weather events hitting America with Katrina still wreaking havoc and soaking up critical funding needed. Between April and May three tornado’s where recorded combined causing again billions in damages. Floods hit at the start of June, with wildfires and droughts combined soon after.
- 2007 – 5 events the first being January to February that saw America plunged in to a massive freeze with snow and ice storms hitting. April to mid-may saw another surge of snow and ice storms, followed in the next month of May by tornadoes. A vast drought sliced the Texan state yet again causing around $5 billion on estimate from July onwards with a small wild-fire recorded from September.
- 2008 – 9 vast and unpredictable events hitting the states again the worst being Hurricane Ike causing $29 billion of damage. February to March and May to June to tornado’s hit, then in between June and July “only” one flood, numerous tornadoes, followed by droughts and heat waves hit the United States hard, causing billions in damages yet again. Between July and August there were gigantic tornadoes and hurricanes with mid-August seeing the other two Hurricanes hitting of which the worst was Ike. 2008 was one of the worst for unpredictable weather patterns but not the most finically destructive. Followed up by wildfires
- 2009 – 6 events hit the United States causing billions in damage the worst being in drought yet again in the Texas region. Three tornado’s hit in from February and just after April then another in June followed by extreme drought casing massive crop damage “although that is to be investigated as of the use of (GMC).
- 2010 – 4 weather events hit America marked as disasters, March to April saw floods, May to June to floods and tornado’s followed then by a long lull in the weather with no disasters reported. November saw more tornado’s hit causing billions more in damage.
- 2011 – 14 climatic weather events hit the United States all close to one another and mostly tornadoes January to February saw massive snow/ ice storms, and cold weather hit the states. From April to mid-June saw six massive tornadoes causing billions of damage, May to June saw floods, from July to September saw a combination of unpredictable weather events. Tornado a massive drought followed by floods in states of America, then wildfires, hurricanes and more “smaller floods” localised hit too.
In total from 1996 – 2011 there was an exact amount of 87 disasters, with an upward total of $541 billion in damages. Of which the United States Government could have reduced via carbon foot print, good education, reduced loss of life through good communication and building adequate disaster shelters. Records show and have been seen by the United States Government on the increase in climate change however this has been ignored time again.
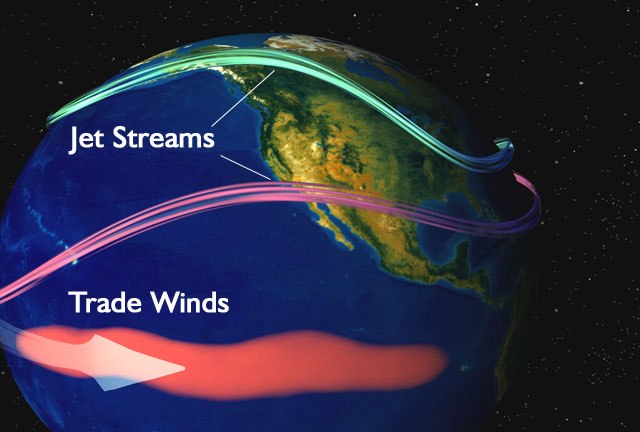
ARE WE LOOKING AT EL’NINO THOUGH, AND WHAT IS EL’NINO?
Methane or CH4 is responsible for a significant part of the greenhouse gases causing Global warming. Methane is a trace gas that only makes up a mere .00017% of the earths atmosphere. In contrast carbon dioxide or CO2 makes up .04% of our atmosphere, also appearing to be a small amount.
Yet these gases along with various others are being said to be the cause of a potentially world ecological catastrophe for future generations. Some people believe the problem could be so serious that it could grow exponentially and affect present generations.
Carbon is generally well understood by the masses. We frequently hear talk about our carbon footprint. Many people understand that carbon emissions come from cars and the amount of electricity we use. They understand that cutting down the rain forest takes away the trees that convert the CO2 back into oxygen. Very few people comprehend the dangers of methane and the serious effects it is having on climate change.
Where does methane come from?
So where does methane come from and just how bad is it? Methane is a principal component of natural gas. It also comes from coal, solid waste, manure, rice farms, waste water, biofuel combustion and most significantly – enteric fermentation. Enteric fermentation is fermentation that takes place in the digestive systems of ruminant animals such as cows, sheep and water buffalo. It represents 28%, the largest percentage of contribution to methane in our environment. The majority of methane emissions come from “large swine” and dairy farms. Makes you wonder how nature is trying to tell us something – swine flu and mad cow disease.
Methane store in permafrost & oceans
The main concern with Methane is the amounts that are stored in our permafrost and our oceans. Currently the world has an output of 6 Gigatons of greenhouse gases a year. The problem – there are large clathrates [or methane stores] frozen into sediment along the ocean margin. How much? – An estimated 2000 to 4000 gigatons. Wow! Now add to this the fact that as the permafrost is melting in Alaska and Siberia, it is exposing stores of methane and carbon from bogs, although not as much as clathrates, creating a potentially serious cumulative effect.
Hope for the future
There is a bit of hope in all of this information. An equal amount of methane as compared to an equal amount of CO2 has an effect on global warming of 20 times greater than CO2. Carbon Dioxide (CO2) will stay in our atmosphere for around 100 years. With a half-life of 7 years Methane last around 10 years in our atmosphere. It is estimated that 60% of global methane emissions are related to human activities. Some scientists believe that these green house gases are as significant as or greater than CO2 emissions from cars.
What if we could significantly reverse methane emissions? Due to the short half-life of methane, a significant impact could be made to slowing or reversing climate change by reducing methane combined with reducing CO2. It is simple to do this and it can be done virtually overnight if people understood. By reducing animal consumption, which in the US accounts for 70% of our diet, the need for large herds of livestock for human consumption would be dramatically reduced.
Additionally, the carbon footprint of growing vegetables, beans and grains is a fraction of that generated by animal farming. An additional benefit is that reducing animal consumption would improve the general health of people.
In conclusion by combining a change in lifestyle with ingenuity of containing emissions and burning them for energy, improved energy efficiency and conscious use of renewable energy we may just be able to maintain our existing coastal cities for future generations to enjoy.
Our CLIMATE report has not FINISHED and we will be making sure that EVERYTHING this year without FAIL is documented on that the GOVERNMENT of the UNITED STATES FAIL to do.
WE ARE WATCHING
For more information or to join us, or further you environmental, marine, botanical, animal welfare, or more - skills please contact us - WE ARE NOT YOUR AVERAGE “RESCUE”


Thank you for your reply, should it merit a response we will respond in due course. This site is owned by International Animal Rescue Foundation and moderation is used.