California: Mega-drought looming.
“California mega drought is impending”
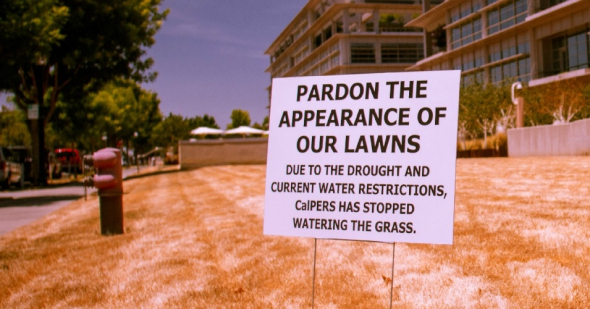
DESPITE man-made circulation systems, concrete canals and pipes that bring water from distant mountains to farms and populated areas California is still under an intense three year drought. California’s drought not only affects local citizens but the economy, wildlife and can increase crime and anti-social behavior.
Scientists have already stated a “mega-drought” could be one of the worst in California’s history that’s reduced much Californian landscape to a brown frazzled patch of soil. The people of Los Angeles are not new to drought or lack of rainfall though.
Back in 2011 California recorded a total of 12 inches of rainfall, in 2012 eight inches of rainfall was recorded and, in 2013 a measly (two inches) of rain was recorded for the entire year. Records for the first six months of 2014 recorded a total of one inch of rainfall. 2015 records to date do show a slight improvement although nothing to write home about.
Drought has been recorded within the “California area” since 4000 BC way before the state was founded. Climatologists recently recorded a dry period of some 1,300 years via the use of measuring aged tree stump rings. And, more recently, an extended dry period that began about 1,050 years ago likely helped cause the absolute collapse of intricate Southwest American-Indian societies.
Meanwhile while this three year extended drought is being recorded as “possibly” the worst “mega-drought” in California’s history floods have also took their toll onto the state of America founded in 1850. While the area has been affected by what we consider natural drought since 4000 BC floods have also been noted although these are mostly caused by riverine flooding. Floods of 1825 changed the course of the Los Angeles River from its western outlet into Santa Monica Bay following the course of Ballona Creek to a southern outlet at San Pedro Bay near where it is today. January 1850 floods devastated Sacramento.
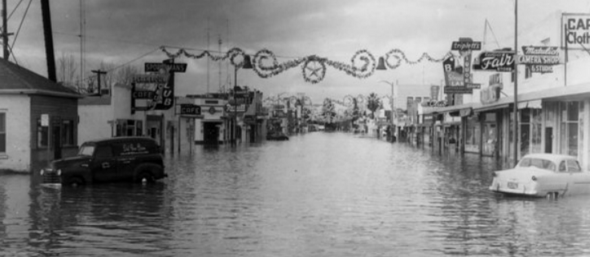
Image: 1955-1956 California was hit by some of the worst floods in 90 years.
The Feather River, the Sacramento River’s main tributary in the northern Sierra, rose to 250,000 cubic feet per second and flooded Yuba City and Marysville. The flood destroyed hundreds of buildings (image above) and killed at least 60 people. Such flooding provided support for A. D. Edmonston’s 1951 plan to build the Oroville dam.
December 1861 residents within California witnessed the largest floods since the state was founded in 1850 known as the “Great flood of 1861”. The great flood began December 24th 1861 lasting some forty five days. The “Great flood of 1861” lasted until January 9th to the 12th, 1862. Further flooding events have been noted from 1909, 1933, 1937, 1938, 1939, 1950, 1955, 1964, 1976, 1986, 1995 and 1997.
The most recent recorded flooding event for California was noted December 11th 2014. Documented as “Big Wednesday” Hurricane Marie was blamed for this latest event of flooding. Hurricane Marie‘s center remained well away from land throughout its entire existence, its large size brought increased surf to areas from Southwestern Mexico northward to southern California. Off the coast of Los Cabos, three people drowned after their boat capsized in rough seas.
In Colima and Oaxaca, heavy rains from outer bands caused flooding, resulting in two fatalities. Similar effects were felt across Baja California Sur. Toward the end of August, Marie brought one of the largest hurricane-related surf events to southern California in decades. Swells of 10 to 15 ft (3.0 to 4.6 m) battered coastal areas, with structural damage occurring on Santa Catalina Island and in the Greater Los Angeles Area.
A breakwater near Long Beach sustained $10 million worth of damage, with portions gouged out. One person drowned in the surf near Malibu. Hundreds of ocean rescues, including over 100 in Malibu alone, were attributed to the storm, and overall losses reached $20 million.
While floods have been recorded in California’s history a mega-drought is still threatening many communities, farms and rural populations. International Animal Rescue Foundation’s - Environmental News and Media uncovered startling evidence of “some” farmers now selling their collected water instead of crops as the water is netting more profit at the moment than staple crops are.
“Climate change is not the main aggressive factor here affecting California’s residents and farming communities” Jose Depre stated. “The main problems surrounding California’s drought is the misuse of water and increasing populations”. “People are mostly to blame here and poor water management rather than just “climate change” stated Depre, Chief Environmental Director for International Animal Rescue Foundation, Say No To Dog Meat and Speak up For the Voiceless.Org”.
May 5th 2015 California introduced a newer and tougher water restriction since since the drought of 2012 began. California’s state water board have have approved emergency drought regulations that aim to slash the misuse of water down by some 25%. The measures call for cities and water agencies to reduce water usage by amounts ranging from 8% to 36%. The State Water Resources Control Board drew up the rules to meet Gov. Jerry Brown’s order for a 25% cut in urban water use statewide.
It’s the first time that California has ever put in place mandatory reductions in water use. The plan reflects just how bleak the state’s water picture has become. The snowpack in the Sierra Nevada has shrunk to a record low. Groundwater levels have plummeted across much of California, and in some areas of the Central Valley, the wells of hundreds of families have run dry. Furthermore while families and farming communities are suffering so too are wildlife.
Environmentalists at International Animal Rescue Foundation are now concerned the shortages of water and the impending summer that’s just around the corner will begin to have more than an adverse impact onto local wildlife that are already threatened with drought and wildfires.
While the residents of California can voice their concerns and take the relevant actions to adapt to drought the “silent sufferers” are those non-human species that rely on water to live, feed, bathe and hunt. Many native species of flora and fauna are already being forced to change their routines due to the serious ongoing drought that’s reported to increase this summer 2015. Furthermore the threat of wild fires is only around the corner that will increase pressure on native flora and fauna species furthermore.
75% of Southern California’s water supply derives from the Sierra Nevada Snow Pack. Should this 75% melt Southern California’s wildlife will be placed in extreme danger of death. Human civilization will undoubtedly suffer while the economy, businesses and organisations will feel more than hot pressure. Crime and unemployment will rise too followed by murder and gang related crimes.
From January 1 through to January 25th of this year CalFire responded to 406 wildfires. But in that same time period for the past five years, the average was just 69 wildfires. Meteorologists don’t expect much rain in 2015 during the usually wet spring months, so the heightened fire danger is expected to continue straight into the summer.
One of the very worst recorded wildfires to hit California for “2015” was recorded this February that saw some 50-75 km winds fanning wild fires leading to over five hundred residents being forced to evacuate the two small California towns at the eastern base of the Sierra Nevada. Brown said even rain wasn’t enough to put out the fire because a three-year drought across California created extremely dry timber brush that fueled the flames.
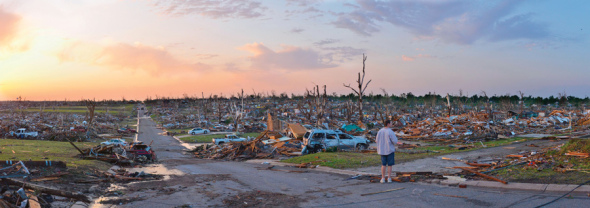
Should the three year drought continue its course of destruction thus seeing wildfires occur the effects onto local wildlife would be catastrophic and something that we do not think the locals are prepared for. Wildfires displace animals, displacement means some if not many of these animals caught up in wildfires can unfortunately end up in human populated areas which can cause some concern especially if larger predatory animals are displaced.
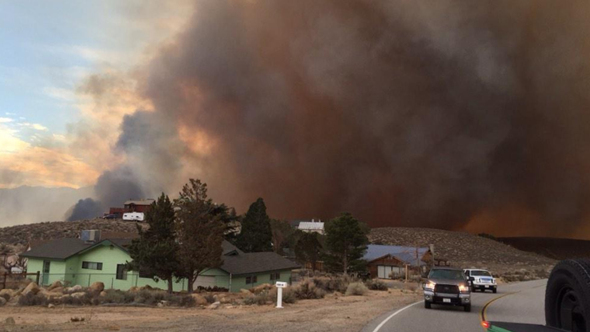
Image: Wild roundfire - 2015 California.
International Animal Rescue Foundation has voiced its concerns regarding drought and black bears that could/will begin to breach California’s human populated areas in search of food. Black bears are very adaptive and very mobile, so they will usually be able to take care of their daily needs in a drought situation. But then they’re coming down to the lake to drink a lot, coming down for food. If the drought persists, it greatly increases the odds of a negative interaction with people. When or if this happens we’ll most likely see hunters brought in to control the species to keep populations intact or even possibly a temporary cull of black bears to reduce human species conflict.
Quote: “It was a surprise to see a bear in this part of the neighborhood”
Farm animals are also affected by California’s “unusual drought” of which residents have reported sightings of cattle and smaller animals within their back gardens. Migrations and hibernation’s are also being thrown of course due to the drought. One commonly known species, the Monarch Butterfly has been seriously affected by the drought of which its populations are decreasing.
Monarch butterfly numbers are falling, in part due to lack of food and the changing weather patterns along their migration route. The butterflies’ winter destination is Mexico; they travel thousands of miles south from Canada and the United States. Some settle along the warmer parts of the California coast, like Pacific Grove, near Monterey.
The larvae (caterpillars) of monarch butterflies eat “only” milkweed. The larvae stage is the only stage of the monarch butterfly that feeds on milkweed; there is something in milkweed that allows the caterpillar to grow and keep all of the vitamins needed to transform into a beautiful butterfly. In turn, the adult butterflies consume all sorts of different foods including nectar, water and even liquids from some of the fruits we consume.
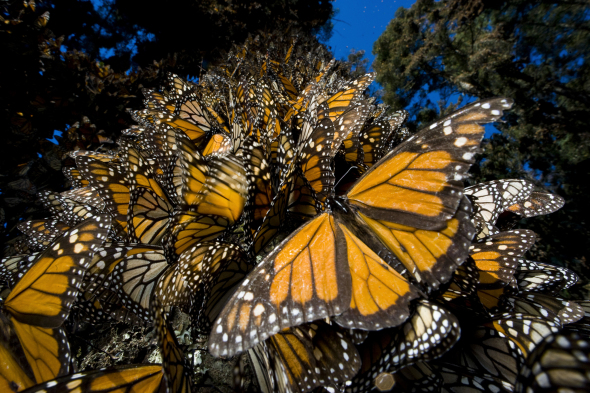
Image: Monarch butterflies decline since records began in 1993
California’s drought has pretty much affected the vast majority of fresh and lush fruit trees that the monarch butterfly requires to thrive on. The World Wildlife Fund for Nature concluded last year in the Sierra Madre of Mexico saw the lowest population count of monarch butterflies since 1993 of which California’s drought was being blamed for.
Newts are staying in hibernation for longer periods too which is not considered normal. Newts would normally be seen out and about now. In Ben Lamond both newts, toads and frogs are literally being overcome by drought that’s seen devastating declines and deaths. While most amphibious creatures dig deep into the soil to take evasive action from such harsh environmental events sadly, the evasive actions taken are not helping to reduce the number of newt, frog and, toad deaths all of which are critically important species of fauna that are required to keep insect populations intact.
When early settlers arrived in California they drained Some 90% of California’s wetlands to create farmland and goldmines of which has had an adverse effect to amphibious species of fauna. Ecologists are trying though to reverse this trend that would help to increase amphibious species. Many amphibians breed and lay their eggs in wetlands. After their aquatic young develop they can survive on land, but they must return to a wetland to create the next generation. With such harsh drought increasing in its third consecutive year many amphibian creatures will be wiped out.
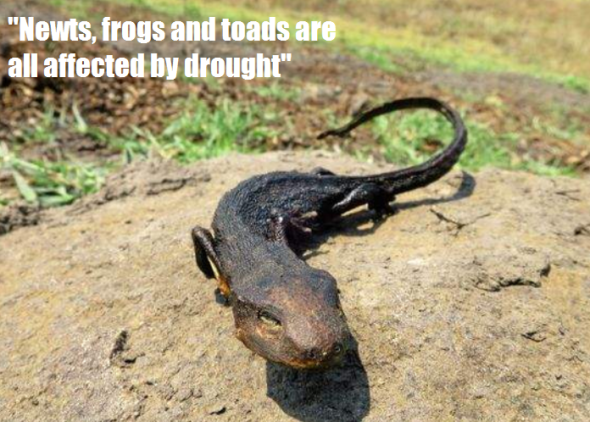
Image: Ben Lamond newt rescued from its natural habitat that has since dried up
Things do work out better for native amphibians though if a wetland dries up for “part of the year”. When it comes to amphibians’ predator control, drought can be a good thing, and timing is everything. While most of the three year drought period has dried up substantial amounts of wetland California’s native frog, toad and newt species will undoubtedly suffer in the long term too.
Unfortunately its not just our smaller species of wildlife that are affected by the impending “mega-drought”. International Animal Rescue Foundation’s marine and fresh water wildlife department has uncovered starling evidence of marine and fresh water mass deaths. 26th May 2015 in Baja, California, thousands of lobsters were washed up on the shoreline dead and alive. Jose Depre, CEO stated “in under two months this is the forth such event occurring on the Baja coast of which the same species of marine life has washed up dead and alive with no apparent reason or cause.
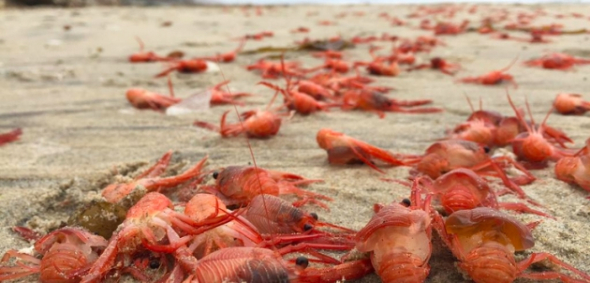
Image: Thousands of lobsters was ashore for the third time this year.
In under two months many more whales have also without reason nor cause washed up along the coast of California. 24th May 2015 a further seven dead whales were sadly seen washed up onto the shoreline. 24th April four dead whales were again washed ashore which has baffled scientists. 7th March 2015 - 1,450 Sea lion pups have washed ashore this year ill and dying - ‘possibly 10,000 have died’ in California, America since the drought began three years ago. Some environmental groups are claiming that ships are the main cause of death however, the sheer fact that California also has seal pups and fish washing up now whales and sharks deepens our concerns regarding such deaths.
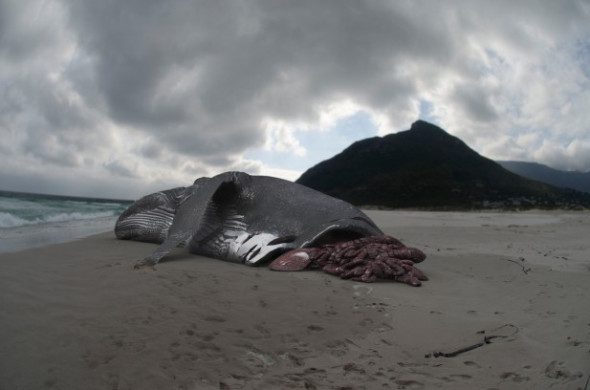
Image: Whales and sharks washing ashore along the coast of California.
This year alone California’s Animal Rescue Clinics have been inundated with call after call regarding stranded cold and emaciated sea lion pups. 2015 has been said to be the worst year for sea lions in California of which the drought has been noted as the main blame. Unusually warm ocean water caused fish to move away from the islands where the sea lions give birth.
Due to sea lion prey moving further and deeper away, the moms are actually gone away longer from the pups. Because they’re gone longer, the pups aren’t getting enough (food) over time. They’re leaving the islands early, and they’re showing up on the shores here, starving to death. Environmentalists have stated the warmer ocean water has more to do with local conditions in the eastern Pacific. The current drought event of three years hasn’t more to do with global warming or anything along those lines. It’s more of a local climate event that we’re looking at. Experts hope the warmer-than-normal water is a fluke and not a pattern.
Meanwhile, while the state of California is under an immense drought California’s citizens are trying their hardest to adapt to what appears to be more locally human induced events rather than as explained “global warming or climate change”. However as much as the local non-celebrity citizens are doing their bit for their state, some celebrities have been noted as either doing nothing or simply flouting the laws.
One only has to take a drive around the suburbs of California to view most non-celebrity citizens once lush green lawns now nothing more than a frazzled piece of sod. Look a little further and one will see many celebrity houses with lush green lawns, filled fresh clean swimming pools and, sprinklers to hosepipes at the ready. Its truly crazy and a sharp smack into the face to our local wildlife and communities that would if they dared use a hosepipe fall prey to enforcement.

Picture above is celebrity Khloe Kardashian’s home that is decorated with lush green lawns, trees and crisp blue swimming pool. While on the left hand side of this image you can clearly see the impacts of California’s drought slowly but surely destroying even the hardiest of drought resistant grasses.

Celebrity Rob Lowe’s immaculate garden can be seen above that is flowing with green lush lawns and shrubs. Meanwhile on either side and circled in red for your attention are the effects of drought. One doesn’t really need to research or understand how much water is required to keep such lawns in this acquired condition. Even within the United Kingdom where rainfall is a weekly occurrence such lawns of this type would not be seen in your everyday garden. Again this really is a slap in the face of those small animals that have no voice to shout for help. Furthermore if such celebrities that are supposed to be setting a good standard continue to flout the laws so will the local citizens.

Celebrity Jennifer Aniston does set a small example with the use of solar panels however then, lets herself and community down with lush green lawns and fresh crisp blue swimming pool. While on the left hand-side of this image one again can view the impacts of California’s three year drought slowly browning even the hardiest of drought resistant lawns.
Out of ninety celebrities gardens viewed within California sixty three had lush green lawns and with some thirty eight out of the ninety owning at least five swimming pools. Out of just the ninety observed, forty had hosepipes on show with a sprinkler attachment clearly visible. Only one home that we did view which was that of Kayne Wests that actually showed nothing but bare grey-ish, brown scorched grass.
California’s drought is expected to continue through to next year with little or no hope of the much needed rainfall. Concerning is that should the state of California continue to dry up into a slate of rock any such intense and prolonged rainfall will simply run off placing water reservoirs and concrete canals under immense pressure. Furthermore the longer dry spells persist with misuse of water the chances of heavy rainfall must be taken on board by all Californian residents. Floods may be uncommon but they can occur very quickly without warning and cause untold damage to large swathes of communities and the local wildlife.
There are many community projects that are now taking place all over the state such as Water Free Wednesday, horticultural drought resistant gardening and rebates for those that knowingly help to reduce their water intake. Furthermore tips on how you can save water can be viewed here below.
Thank you for reading.
Dr Jose C. Depre
Environmental and Botanical Conservation.
Environmentalism chapter 2 Climate destruction
Fossil fuels are the number one contributor to pollution within our environment of which we still are not reducing our consumption levels that’s placing our sensitive ecosphere in danger and will push temperature levels up by another two to three degrees Celsius.
The world climate agency along with governments and meteorologists and climatologists have warned practically everyone to reduce their usage and start switching to alternative methods of fueling ones home’s to automobiles, passenger planes and ships.
Unfortunately like a broken record ourselves and meteorological agencies to governing bodies still seem to be warning you “again” that your usage is not just depleting fossil fuel levels that need to stay stored for any potential future natural disaster but your usage is increasing climate temperature and sea levels, increasing flooding, extreme weather events, more saturated winters, plus death tolls, physiological and psychological illness and increased economy damage thus in turn decreasing funds that are desperately needed to construct rigid sea and river flood barriers to even improving natural energy supplies and awareness.
Fossil fuels are hydro carbons such as gas, oil, coal, petroleum and methane that have been formed in our geological past from the remains of natural living organisms that are now deceased. Fossils are literally the remains of animals that died some million years ago that have then “fossilized” thus creating a type of rock like layer that remains buried deep below the soils surface Please view the picture below of a “fossilized remain” of the Archaeopteryx a species discovered in 1861 from the remains of the 150 million year old prehistoric realm.

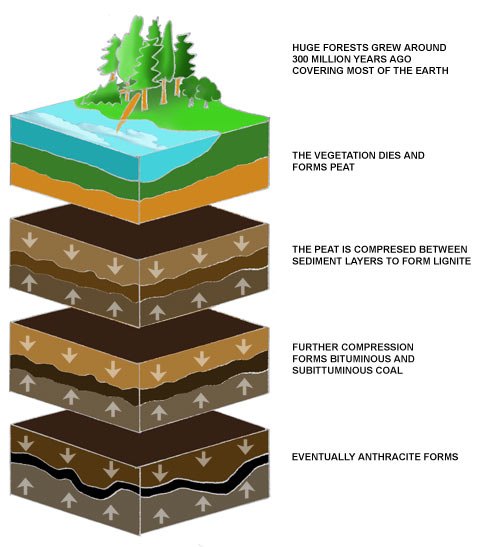
The picture below is what a “typical fossil fuel looks like” this being Coal. Look closely at the picture and you can view not just coal but the fine lines within the structure of this fossil. These lines are that of vegetation that has gradually become impacted over millions of years hence where your then able to obtain “combustion fuel”. The picture below this explains more on how these layers on formed.
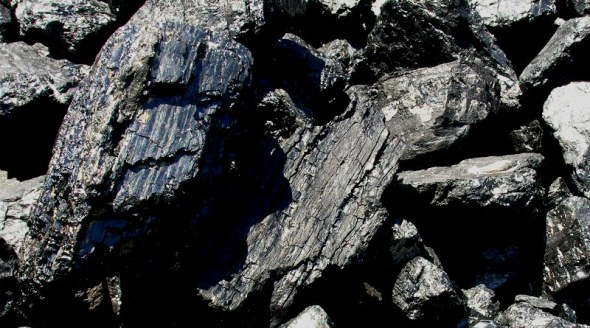
Coal formation is a million year process that stores and natural deposits hundreds of feet below the soil surface hence why miners use heavy rigs and explosives to blow the coal from the interior of a dug mine. Picture below illistrates clearly the coal process formation.
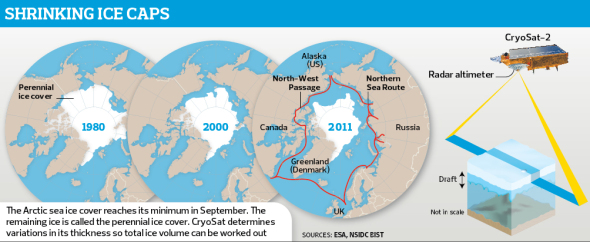
Every government and almost every soul on the planet over six billion people to be almost precise has been warned and educated to reduce start turning to the alternative methods of wind, water, solar, to green plant liquid based power some of the top four natural energy sources that can be easily stored to reused again thus decreasing pollution levels greatly increasing air and living quality, lowering food consumer prices to practically slowing but regrettably not ceasing climate change. I state “not ceasing” as sadly we are now past global warming which has been made more than evident by drastic and worrying changes to the polar ice cap.
Transitions that one can move over to now that are cheap is wind power that can easily generate energy, to solar energy that can be gathered from solar panels on our home roofs to even just fixed within a garden, water energy using the forces of the earth’s gravitational pull to flow downstream to then turning a water turbine creating momentum = energy, to algae fuels that can be used as cattle feed, to petroleum and oil to power homes, generators, cars and passenger planes plus much more.
The possibilities are endless and it’s not just fossils fuels to, its reusing liquids and solids such as vegetable oil, rape seed oil, sunflower oil, to recycled paper, recycled wood and more yet we are still consuming vast amounts of million year old fossil fuels with no real evidential decrease of such fuels which will only lead to catastrophic environmental meltdown.
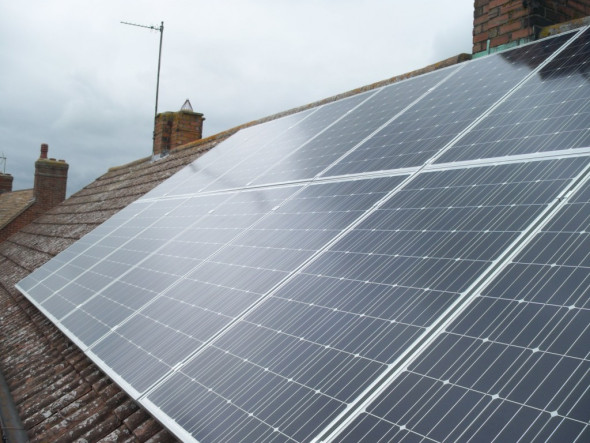
Picture above is a typical English home with solar panels fitted. Solar panels not only conserve energy thus releasing it to heat your water, to power your washing machine and dryer, central heating and most of your electrical charging equipment but can reduce your “energy bill” to = less carbon output from factories to produce energy = less emissions and a happy earth. he total cost estimated for fitting a whole four bedroom house is $14,000. Some come with free fitting of a %. You may think this expensive however if your paying a month on average a total of $100-150 your going to be SAVING $150-$250 a month.
“In short, the best way to get greater value for money when it comes to solar energy is to invest in buying and installing solar panels yourself. Plus, in paying for it, you could earn in the region of £35,000 over 25 years. That’s not a bad return on your investment by any estimation” Please remember to always as questions if you plan on having them fitted by professionals as this could effect your home from being sold in the future. Please also view the “feed in tariff” http://www.solarguide.co.uk/feed-in-tariff-fit
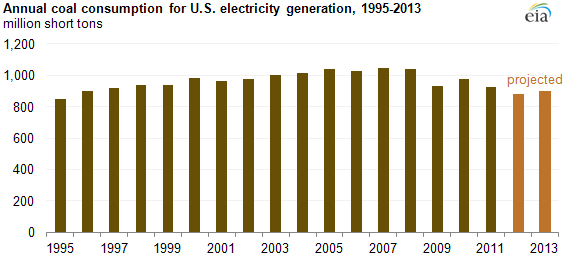
Looking at the environment that we are living in to date starting from the 1st January 2013 we firstly take a look at our coal consumption. America and China are still the largest carbon discharges of coal of which was estimated in reports back in 2011 that there was 909 billion metric tons of coal that lay beneath the states of America that would sustain the United States for another 155 years.
Fossil fuel usage
Coal usage for America and China;
China’s coal consumption from 2010 was estimated at 3.2 billion metric tons per annul of which the Kyoto Protocol has called for a decrease of 403 million tons by 2012 however this is not evident and within 2012 sink holes in many regions of China where vast underground networks of coal mines are blown have opened up taking civilians with them with loss of life.
America though has seen a vast decrease in coal mining of which 2008 was their highest peaking level with a usage in the final fourth quarter of exactly 299,552 thousand tons of coal, from 2005-2008 saw the most concerning usage however from 2009-2010 the levels of usage have dipped and peaked of which 2010 saw 276,180 thousand tons used in the last fourthly quarter per annul.
The 2011 quarter saw, 282,853 thousand tons of coal used with a massive decline which the United States Energy Information Administration quotes a usage for 2012 being 259,029 thousand tons of coal usage.
Total U.S. stocks declined to 235.3 mmst from 255.1 mmst in the second quarter 2012, an 8.9 per cent drop. However, this was 17.2 per cent higher than in the third quarter 2011.
Total U.S. consumption was 254.0 mmst for the third quarter 2012. This was 25.8 per cent higher than in the second quarter 2012 and down 9.2 per cent from the third quarter 2011 level.
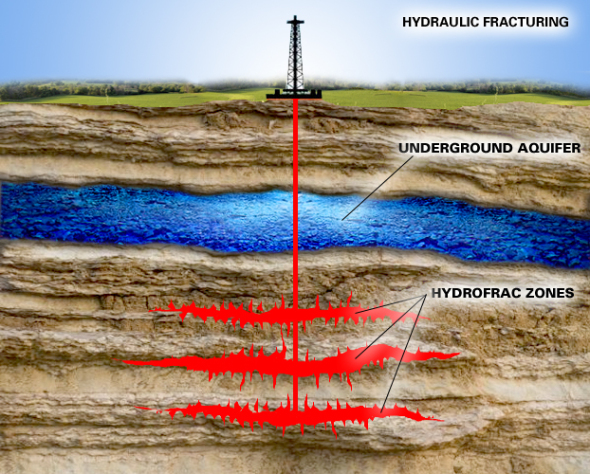
Pic above is shale fracking. Fracking for shale is environmentally dangerous to our health and clean water supplies. There has been much damage caused to peoples homes, roads and environmentally protected areas from which vast sized sink holes have appeared sucking homes, and people within them.
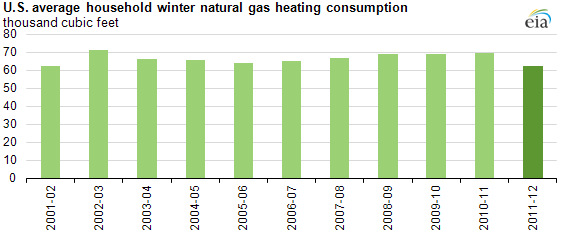
Gas usage for America and China
America’s gas consumption shows a much different picture from 2008-2012 again we see within this century that gas usage and gas production peaked. The United States of America produced 23.0 trillion cubic feet of gas which was 20% of global production of natural home gas. The unfortunate news is that in 2011 the whole of the entire states of America consumed all and more of that gas at a total usage of 24.5 trillion cubic feet.
The worrying image that was laid out here by the United States Energy Information Administration that there is only ninety more years of shale gas left within the United States hence why they are now “importing” gas to keep up with the demand, by importing then one is reducing other vital areas of their natural deposits that then see that continent or continents effected more by environmental phenomena.
The United States is now working more on the “shale gas supply and production” than they are coal of which the US describes this as “energy security” and not “energy independence” which is worrying. By taking more shale then we are just depleting more resources and yet again not solving the “problem” just merely masking it until eventually there will be a complete burn out.
The diagram illustrates shale gas drilling which is roughly 1.5 miles below the soil surface to extract shale gas. The correct terminology for this process is Hydraulic fracturing which causes much seismic activity, disruption to water supplies to earth tremors to.
The picture above is on-land shale gas drilling probably one of the most dangerous forms of fuel extraction environmentalists have viewed, however more governments are giving the go ahead for “land drilling” than sea bed drilling.
Natural gas is combustible gaseous fossil fuel. While contributing less CO2 to the atmosphere than other fuels, it is still a serious greenhouse gas. (The average U.S. natural gas plant emits 800 to 850 lbs of CO2 per megawatt whereas coal plants emit an average 1,768 llbs of CO2 per megawatt.)
Transporting natural gas by tanker can involve similar risks to transporting oil by sea. With its cost receding in recent years, more attention is being paid to its commercial uses. The main products of the combustion of natural gas are CO2 and water vapor shale gas deposits promise vast supplies but introduce the problem of “fracking” which has serious local and international criticism and is not the answer to our global solutions.
There has already been this year many “fracking” incidents occulting over the states of America with sink holes forming, methane in the public water supply that has worried many locals to roads and houses being swallowed up by the unstable ground beneath where fracking has affected soil structure.
Picture above illustrates a massive sink hole that formed in Louisiana America caused by fracking that eventually grew a mile wide. The report can be read here http://www.bayoubuzz.com/buzz/item/120695-smell-health-issues-reported-at-bayou-corne-sinkhole-in-louisiana
Shale gas is gas that’s trapped in shale deposits, shale drilling or fracking as it is more better known is undertaken on land of which the United States Government believe is the correct course of action to take to reduce global carbon emissions. We, International Animal Rescue Foundation © personally believe this to be untrue based on scientific knowledge, geology, climatology and environmental sciences.
More governments now though in the European Union have now given this the go ahead even though 2012 has seen more evidence of sink holes forming, methane in drinking supplies of home owners near shale drilling sites, to seismic activity. 3rd of January 2013 saw another sink hole form beneath Harrisburg city streets http://www.pennlive.com/midstate/index.ssf/2013/01/there_could_be_other_sinkholes.html of course this could be due to an old abandoned coal mine that we know was evident in this area, to a burst water main. However sink holes are forming now on a daily basis all over the United States.
There is more than enough evidence to prove that drilling or hydraulic fracking as it is better referred to is causing many problems with land destruction and habitual displacement to even forcing people from their own homes as they live on top of a rich shale formation.
http://rt.com/usa/news/sinkhole-mass-evacuation-louisiana-684/ Louisiana, America
http://www.alternet.org/rss/breaking_news/583881/shale_gas_drilling_linked_with_water_contamination Water contamination United States
http://english.caixin.com/2012-12-27/100477886.html Shale gas sink hole opens up Taiyuan, Shanxi Province, China.
The same dangers can be said though for natural sea gas although natural sea gas is drilled more out at sea than via a combination of two separate platforms one fixed and the other flotation.
http://www.dailymail.co.uk/news/article-2121457/North-Sea-gas-leak-threatens-repeat-Piper-Alpha-oil-rig-disaster-Aberdeen.html United Kingdom
http://www.bp.com/sectiongenericarticle800.do?categoryId=9036575&contentId=7067541 Deep-water Horizon incident – killing eleven
The natural gas consumption usage in China from 2001 to 2011 has gone from low to practically of the scale which is for many climatological reasons that I shall explain in brief further on.
2001 saw a total usage rate within that year of 27,400,000,000 cubic (meters) of which then sporadically shot up in 2005 to 47,910,000,000 cubic meters with the final year of 2011 with a total 129,000,000,000 cubic meters.
According to International Energy Agency’s June 2012 report, the share of natural gas is set to rise in China’s energy mixed nation, which is expected to have strong implications on the country’s energy usage in the years to come given the increased importance of gas within China.
China still though remains the largest carbon emitter which coal constitutes around 68 per cent of China’s energy use. With the current birthing trend increasing to and climate change bringing unpredictable weather patterns then China will be using “more than the 68% as stated in 2011”.
As part of its 12th Five-Year Plan (2011-2015), China has put a particular emphasis on cutting carbon emissions by reducing its use of coal and oil. Natural gas is the preferred energy source to achieve this goal. The Chinese government has set an ambitious goal of increasing the share of natural gas in the energy mix from its current 4 per cent to 10 per cent by 2020 and cutting carbon emissions by 17 per cent between 2011 and 2015 through closure of energy-intensive enterprises.
This is yet though still to be seen and with such a massive population trend then we doubt very much that China will decrease on its coal and oil usage but look for more sea and shale gas which will be exhausting all natural reserves. Only in the current news last year 2012 we see that India is now having more the same problems with fulfilling energy demand hence why there is now a stand of with the Chinese government and Indian government of where India is likely to drill within China’s “so called disputed of shore gas and oil fields”.
Brief conclusion
Should all three top populated nations not cease their carbon output greatly, and introduce more wind, solar, water and recyclable energy then carbon emissions are going to rise vastly. China must now take hold of its current population boom of which it holds more people than any other nation on the planet.
Fracking for more “so called environmentally safe gas” must be explored more before anymore new wells/holes are drilled that are causing much soil, and tectonic disruption, habitat destruction, population displacement and life loss.
Natural energy usage for the top largest continents
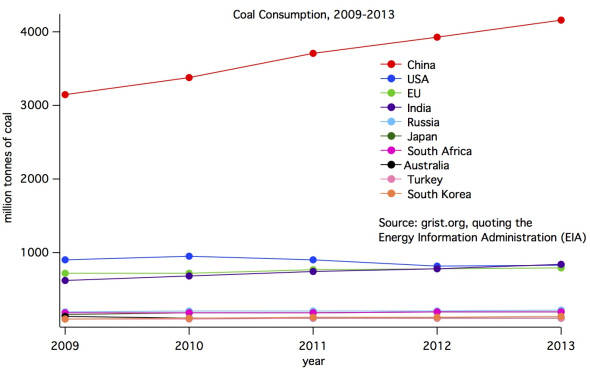
Below I have illustrated the growing demand by in one graph for the top consumers of Gas. Graphs are not owned to the International Animal Rescue Foundation this is international meteorological data.
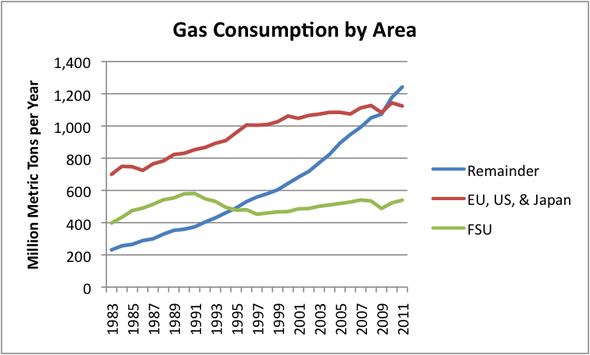
Carbon emissions internationally are projected below.
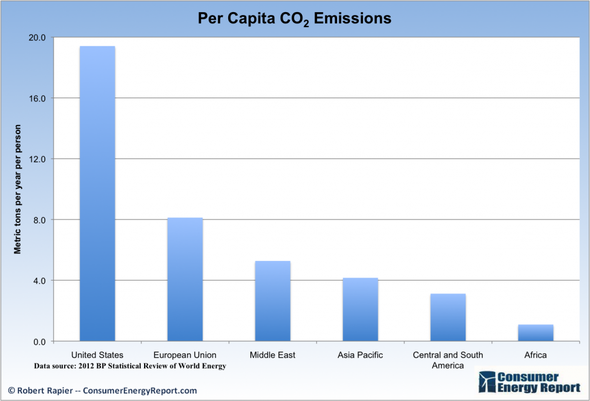
As one can see the trend below has risen.
Current population trend
China, India and America make up most of the world’s population, keeping India out of this equation for the time being the total number of people living in China as quoted in the 2012 United States Census Bureau (USCB) is 1,355,140,000 from the 1st January 2013.
America though has to date January 1st 2013 a total estimate of 315,039,000 of people living within its borders to date (with another 1 child born every four seconds since typing this report). Although it was stated in the 2010 census that the average family size in America had decreased these are still shocking and alarming figures, India being the second largest populated continent on the earth with a total count taken from the 2011 (USCB) reports show 1,210,193,422 people.
The actual “estimated” population has grown dramatically since 2010 which was estimated at only six billion however the total number to the nearest figure now stands at 7.062 billion. Asia is by far the most populated with 4.2 billion with America and Canada standing at 352 million people combined however the entire European Union consists of an estimated 773 million people making up 11% of the world’s population.
So in reality the census of 2010 carried out by the Americans the European Union is slightly inaccurate if one is quoting that family sizes are decreasing as the Census of the 2010 and the European Census of 2010 has shown that the earth’s population has risen by an extra 1.062 billion. That is four babies born every four seconds that’s exactly 130 million born internationally every year.
On the 1st January 2013 the Royal college of Midwifery, United Kingdom has voiced their concern over the recent baby boom just in (England) and not including Scotland, Wales and Northern Ireland. The figures were up again with an exact number of 700,000 babies born in England alone. That’s almost another 1 million that are registered as born, and doesn’t include non-registered births mainly from illegal immigrants. So the total could be just under or of over 1 million for 2012
Going back to some of our previous data that we have analysed over the past years along with climatological and meteorological conferences we can see that none of the above is going to work unless we adopt the four main elements of wind, solar, water and other recyclable energy in the long run along with adopting a more greener life and living style. We must also as responsible humans now look for other newer green forms of energy processing that are both economically and environmentally friendly to ourselves and Mother Nature.
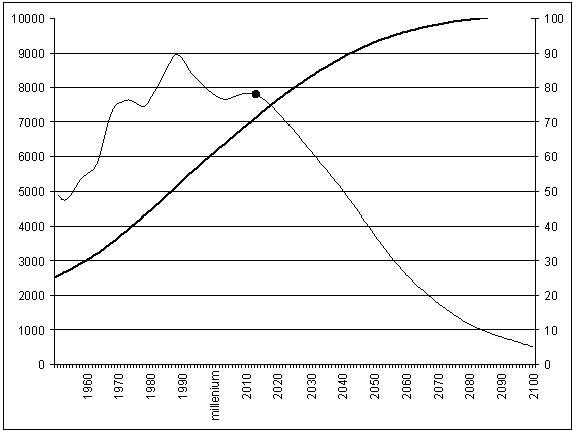
World population estimates and projections and annual population change (millions) – UN median variant scenario, change on right hand axis and drawn as thin line.
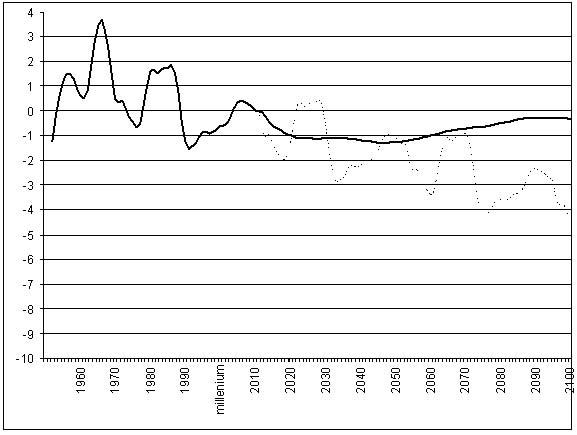
“Alternative scenario drawn as thin on the dotted line”
“This is too hard for some governments to understand though as they are corrupt and just want a quick buck within their pockets.China, India and America are the largest polluters on earth although they say now they wish to cut down on their “carbon emissions” and then look for cheaper alternatives such as shale gas (more or less the same as natural gas”).
What they seem to be forgetting is “environmental change” which is not becoming brighter its progressing now of control and well within the black zone.
We must not though dish neither nations as they are actually “starting to introduce to a degree greener power energy” (it’s coming at a price though) which “they need to bring down” for the consumer/purchaser or we are simply going to get no where and fast.
All three of the top populated nations are now battling it out to find the best oil, shale and natural gas sea bed fields to fulfill their nation’s needs.
These irresponsible governments though are overlooking the main issue here of which to decrease climate change then they must act accordingly with what the climatologists, meteorologists and geologists are educating and showing them.
Stupidity
- Usage of more coal to keep up with demand
- Fracking for shale gas which has investigative proof showing harm to the environment
- Drilling for natural gas
- More oil and petroleum demand
- Nuclear energy
- America now wanting to build more coal plants
The five following fuels now need to be reduced on a rapid scale. Should there be no slowdown yet more usage of natural resources rising then we are going to be viewing more climate change and natural to more or less man made disasters.
United States International Energy agency seems to be missing a very important point here of which we have explained in great detail over the course of five months. Worldwide population censuses have quoted that family numbers as in (birth rates) are decreasing as the USIE state.
This just doesn’t make sense though and that is what we are going to explain now by moving away from the actual “fuel usage” to the actual “climate deterioration” which we and many other environmentalists took part in, in the last global summit of weather and pollution control 2011.
The United States International Energy Agency are all up for placing good figures up that show a “decrease” in fuel usage but what about climate destruction increase and climate destruction damage expenditure overall increase of alternative energies and carbon emissions?
Carbon emissions for United States of America on a whole
As reported in a journal on July the 18th again we see misleading data being placed which is not taking into the account the “climate change increase” obviously there seems to be no experts within the USIE.
Carbon emissions where stated to have been cut by 7.7 per cent since 2006, with an overall total of U.S emissions being sliced in 2011 by 1.9 per cent that will then place the United States back to the level of 2006.
In a media report August the 16th 2012 the report stated that 2012 emissions have fallen and the United States was leading the way to decrease Co2 emissions. President Barack Obama also quoted that he will “ensure” that carbon emissions will decrease by half 2020.
The most worrying concern for us again was that a frenzy of shale gas drilling in the Northeast’s Marcellus Shale and in Texas, Arkansas and Louisiana has caused the wholesale price of natural gas to plummet from $7 or $8 per unit to about $3 over the past four years, making it cheaper to burn than coal for a given amount of energy produced. As a result, utilities are relying more than ever on gas-fired generating plants = climate change.
Fracking is not the answer and even the united States have warned that fracking is in their own words below
“Drilling has its own environmental consequences, which are not yet fully understood”.
America was quoted as reducing its other fossil fuel usage by 16 per cent in the last six years. Total U.S carbon emissions from consumption peaked at about 6 billion metric tons in 2007 the projections for 2011 where 5.2 billion metric tons and the 1990 figure were exactly 5 billion tons for overall consumption emission output.
America has “quoted” to leading the way in reducing its emissions by using hydraulic fracturing however they have yet again been warned like in the previous years before environmental impact hit us from 1980 that (hydraulic fracturing) or fracking as it’s better known is and will cause more harm to the environment along with placing the general public’s life in vast danger.
We International Animal Rescue Foundation © along with many more conservationists, geologist’s and environmentalists have stated that fracking is only going to cause more long term damage to the environment and is still not yet fully understood of what the impacts and long term damage this is going to cause. One “unnamed” environmentalist quoted.
“Fluids have polluted underground drinking water supplies and that methane leaks from drilling is causing serious air pollution and also contributing to global warming. The industry and many government officials say the practice is safe when done properly. But there have been cases in which faulty wells did pollute water, and there is little reliable data about the scale of methane leakage”
Carbon emissions for China on a whole
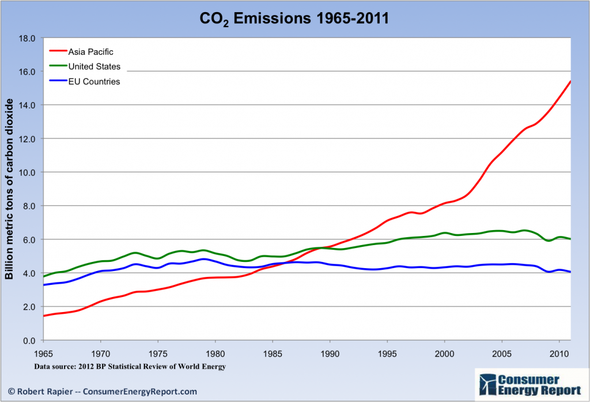
From 2011 China’s carbon emissions on a whole where estimated to be at 9 billion metric tons making China the largest polluter accounting for 28 per cent of the entire words emissions. As quoted America only accounts for 16 per cent of the entire planets emissions. China and America are both practicing hydraulic fracturing, China are America are causing widespread global damage.
China’s carbon emissions grew 9.9% in 2011 after rising 10.4% in 2010 and now comprise 28% of all CO2 pollution compared with 16% for the United States. The University of East Anglia has been monitoring these changes and also reported that should the overall usage not decline for the three largest nations China, India and America that make up the overall output then we are going to be heading for climatological destruction through global warming.
“The research by the Global Carbon Project, an annual report card on mankind’s CO2 pollution, also says emissions grew 3.1% in 2011, placing the world on a near-certain path towards dangerous climate change, such as more heat waves, droughts and storms”
Climate change concern
Demand is increasing as population is rising to with still no reduction in the price of alternative fuels, still millions of tons of waste being pushed into landfill sites.
More cars are on the roads as driver are becoming younger although insurance is at an all-time high and although the governments and government paid scientist think tanks are being paid to lie to the public the actual evidence is here and there to prove that America India and China are contributing greatly to the worlds devastating global climate change.
How do we know this though? Well we have to look at meteorological and basic census reports and the effect of weather destruction.
Since 1980 to 2011 America has lost a total of $880 billion in damages caused by climate destruction of which experts warned the governments and ourselves that change is now needed or we are going to be heading for major catastrophic loss of life to economy disruption, fuel and food prices rising and of out of control weather lasting longer or becoming more aggressive and widespread
Billion Dollar Weather
1980-1985
- 1980 – Was the start of real climate change in United States = 1 drought causing 56 billion and 1 hurricane with a total damage loss of 1 billion estimated.
- 1981 – 1 billion in tornado, hailstorms and thunderstorms damage.
- 1982 – 1 billion in tornado, hailstorms and thunderstorms damage.
- 1983 – Four disasters = 2 floods, 1 hurricane, blizzards, ice storms and big freeze each disaster under a total of 5-6 billion.
- 1984 – 1 tornados, hailstorms and thunderstorms under 5 billion.
- 1985 – 5 disasters with blizzard, ice storms and freezes.
From 1980 one can clearly see the destructive weather patterns starting to change that then increased from 1985 to 1990 dramatically in just a five year period.
- 1986 – Was a relatively calm year that only saw one destructive weather pattern which brought drought and heat waves causing damaging crops of $1 billion.
- 1987 – There were no reports of weather damage of which the country basked in moderate four season weather.
- 1988 – One massive drought and heat wave that also went into 1989 causing some $78 billion of damage
- 1989 - Tornado, hailstorms and thunderstorms damage of $1 billion, followed up by the previous 1988 two year drought and heat wave, another heat wave and drought hit the states again causing a further $1 billion in damage at the start of August followed by a $10 billion hurricane causing extensive damage in between September and October. Winter saw a $1 billion trail of destruction caused by blizzard, ice storms and freezes.
- 1990 – 3 natural disasters causing roughly $7 billion of damage
From 1990 the climate change then increased rapidly yet still no major changes where being brought in. The technology was there but “it wasn’t made any cheaper to reduce major loss of property and damage” to life too.
More people where using then coal, electric and gas as the weather patterns where becoming more sporadic. Winters where a little warmer by 1-oc hence why less fuel was needed however when there was and still is major weather patterns moving in more fuel was needed to cope with the strength and longevity of the weather front.
- 1991 – Saw three large patterns move in tornadoes, hailstorms and blizzards at $1 billion of damage, hurricane at just over $1 billion of damage then we start to see the wild fire’s that only started to really hit America hard at this time. This first wildfire was costly at roughly $4-5 billion of damage.
- 1992 – Three tornadoes, hailstorms and blizzards hit causing $1 billion of damage or more then Hurricane Andrew hit causing major catastrophic damage at $44 billion of damage followed by another hurricane at just over $1 billion along with blizzard, ice storms and freezes over $1 billion.
- 1993 – Storm of the century hit the eastern seaboard causing $8.7 billion which again was combined blizzard, ice storms and freeze. Followed by major mid-west flooding at $33 billion.
- 1994 – Six major environmental events blizzards, ice storms and freezes followed up by tornadoes, hailstorms and thunderstorms. More flooding at the start of August wild fire and floods again all costing in excess of just over $10 billion of damage.
- 1995 – Floods, tornadoes and hurricanes (becoming larger) roughly around $13 billion of damage
Total cost of damages that “could have been reduced” but not necessarily stopped from 1980 to 1995 was $339 billion exactly.
What is obvious is the weather pattern change that government paid scientists are still spouting has nothing to do with the way we are living, the amount of fuel to population boom.
The major disasters from 1980 to 1995 where drought and heat wave which caused some $134 billion of damage. Hurricanes where the next biggest which were sporadic and widespread that caused more damage than any other weather front within this period.
In total there were 46 disasters compared to the 87 disasters that have hit the United States from 1996 – 2010.
From 1996 to 2010 there were more droughts between May and October causing $49 billion in damages, wildfires increased but still small in size with eight in total causing roughly $15-17 billion of damage. Twelve floods in total which gives rise to evidential polar ice caps melting = raised sea levels, combined these floods caused an estimated total of $34 billion.
Fifteen hurricanes hit causing massive damage in total between “just” 2004 -2008 there was an estimated total of $27 billion. Starting at 1996-2010 there was at least $96 billion then moving on with another $146 billion from hurricane Katrina, Rita ($19 billion), Wilma ($19 billion), Ivan ($17 billion - 2004) and Charley ($18 billion 2004). A further two more hurricanes hit with one $5-6 billion then just after hurricane Ike hit causing a further total damage toll of $29 billion. 2011 saw a whopping year of $1 billion disasters with one more hurricane hitting casing $9-10 billion just for that year alone.
All hurricanes are now hitting America more in the months of June to November with still more widespread damage being caused as not enough warning is being given to the public. Who picks the monetary pieces up? You do.
Please ensure that if you live in these zones where hurricanes are now more extreme than one either “moves” or you learn to toughen your property up more.
Tornado’s are now rife appearing from nowhere then vanishing but causing gargantuan damage with thirty reported from 1996 – 2011 causing a massive $60+ billion is damages. Going back to 1980 – 1995 America had 10 reported causing as little as $29 billion of damage which were less powerful.
Blizzards, ice storms and freezes have become sparse with very few reported as natural disasters. Seven where reported as disasters from 1996-2011 causing in an estimated $19 billion of damage
2011 had the most $1 billion of disasters with 14 in total in total for from 1996 to 2011 the estimated damage from climatic damages was $541 exactly. 2004 to 2012 being the worst and looking at the figures it clearly shows that we are heading for some serious climatic storms and disasters to come from 2013 2050 unless we now buck our ways up, change our fuels, go green instead of polluting and live a much healthier life style.
One may think that we are nagging and you may say “well you only live once” but what about your children and their children? How are they going to battle with this?
Why is the damage so high though and I mean we are not just talking about the United States. North Africa, United Kingdom, and Asia have all been seeing more or less the same this year for 2012 – 2013.
The main reason why there is so much damage is due to more homes being built on the river flood pains and coastal lines which are all high value properties and with the atmosphere warming scientists have already warned that destructive weather is going to become more common in itself.
Environmental climatic increase
We was all told that the planet was warming up however to what extent one truly didn’t know until the latest 2012 end statistics came in.
Air temperature for the entire planet has increased because of environmental climate change. Temperatures from 1920 were very stable simply because there was few cars on the roads, less factories, birth rates were not erratic and underage pregnancies to non-planned was really not an issue. Air traffic was still at an all-time low thus little to no increase.
Despite the overall increase global temperatures “have not climbed” steadily during the decades. The average global annual temperature hovered around 13.7°C (56.7°F) from the 1880s through to the 1910s. Please view the temperature increases below.
- 1880s 13.73 56.71
- 1890s 13.75 56.74
- 1900s 13.74 56.73
- 1910s 13.72 56.70
- 1920s 13.83 56.89
- 1930s 13.96 57.12
- 1940s 14.04 57.26
- 1950s 13.98 57.16
- 1960s 13.99 57.18
- 1970s 14.00 57.20
- 1980s 14.18 57.52
- 1990s 14.31 57.76
- 2000s 14.51 58.12
The increases were recorded worldwide by the research news and scientific factual data, from the 1880’s to the 1920’s the temperatures remained stable however after the 1860’s car usage began to rise on the roads. 1801 the Cornish Engineer, Richard Trevithick, produced a steam carriage that produced a top speed of 12 mph of which cars where expensive to purchase hence why many individuals used the main transport of the horse and carriage.
Then Steam powered vehicles continued to develop until the arrival of the internal combustion engine patented by the Belgian, Etienne Lenoir, in 1860 which still no real air temperatures increased as again cars where expensive to purchase of which there was worldwide an estimated 15,000 automobiles on the roads that mainly the rich and famous purchased. The arrival though of the four stroke engine was then born at more or less the same time by Gottlieb Daimler and Karl Benz.
Demand then rose for the automobile by the end of 1890 which Karl Benz produced an estimated two thousands motor vehicles on the roads. Air temperatures then started to change “but not of a great concern”. By 1890 the recorded planetary temperature stood at 56.74 Fahrenheit which was relatively low still. All four seasons proved normal weather patterns with very few climatological disasters, there was little if any floods, and little tectonic movement.
By 1903 Henry Ford founded the Ford Motor Company and produced the unmistakable and very practical Model T, using the engine design of Etienne Lenoir. The Model T’s instant popularity changed the demand of motorcars overnight to keep up with the country’s insatiable desire for motoring. Temperatures still remained positively OK of which the demand for motor vehicle practically ceased by 1940’s due to the beginning of World War One.
Temperatures did increase though to 1.0-oc which one could state was due to the on-going war in this era and then the beginning of the modern factory era that was producing everything it could to help European and international armies to fend of Adolf Hitler’s armies.
Once the Ford was invented the automobile then took off with prices being low from 1916 to 1970 temperatures then started to increase standing for 1970 at 14.00-57.20.
On average the air temperature increased from 1970 to 2010 to from 0.1-of to 1.0-of that’s an increase of +0.9oc
Moisture levels rose from 1957 then dropped dramatically by 1970 of which from satellite data the levels for 1970 stood at 10.2%, then by 2010 raised to 10.6% that’s an exact increase of 4% this is based on average global specific humidity at sea level.
Heat waves have increased massively and are becoming now much more prolonged with severity levels increasing to. Animals and humans are suffering the elderly and new born babies are at great risk as they cannot control their core temperature. Night time lows are one indicator striking the United States greatly. 1920 saw a steady temperature level of roughly 56.89of which then lowered from 1920-1940. Moving through the 1940’s we then saw the temperature “heat waves” rise and it was not just the United States being pounded hence why we know this is not just “isolated” to America that some people “want to believe”. Heat waves then lowered right through to the 1970’s
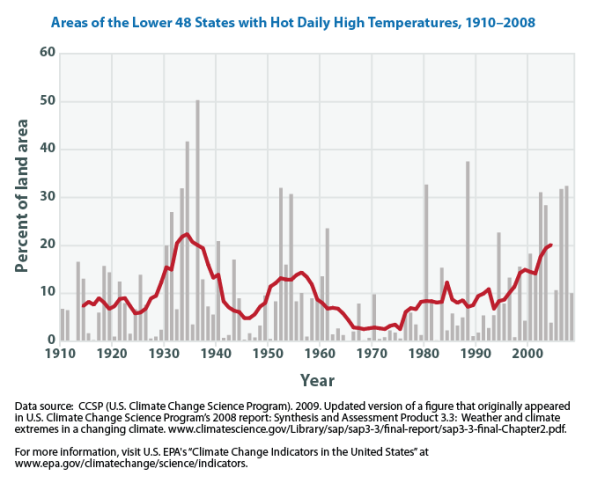
From 1970’s the percentage of United States summer heat waves then increased dramatically, 1970 saw a an increase 4%. From then the heat waves have increased vastly to a percentage of +31% with temperature levels hitting for the year of 2010 over 58.12of that an exact total raise to 35% (and its increasing) with no signs as yet of dropping.
Extreme rainfall levels are now affecting much larger areas of the United States as well as other global continents. The decrease and then increase from the early 1900’s to then 1970 and finally 2010 we can work on yet more flooding catastrophes are still casing widespread damage ranging at just under $200 billion mainly because of homes constructed on flood plains, constructed near coastal fronts that home owners really should before purchasing take in to account these changes BEFORE buying.
The National Climatic Data Centre reported that extreme rainfalls where high in the 1860’s to 1900’s that then dropped over a ten year period to an all-time low by the 1950’s then extreme rain fall rose again in 1955 by roughly 5.8%. Moving to the 1970s the levels of rain fall for the United States then dropped again to an all-time low of which temperature levels where at an average for the planet 57.20of.
From the 1970’s we then see a dramatic increase for the United States of extreme rain fall. 1970 -1975 saw a tremendous amount of extreme rain fall then form 1975-1985 there was again a vast rise that is very evident and shocking, 2010 records prove that from 1970-2010 there was an increase of +7% with the total rain fall increase from 1970 of 9% finishing of at 16% = 7% increase for the total end of 2010. This is just for one nation though of the United States = MASSIVE climate change + CO2 emitter.
Evidence of environmental carnage
Taking a glance at the United Kingdom the current environmental changes are similar in comparison to the that of the United States but one has to remember that the United Kingdom is part of the European Union and has on average a much larger population of the United States “taking in to account the rest of the European Union”.
Since the 1970’s central England temperatures have increased by 1oc which is exactly as predicted by the meteorological office and international climate change scientists. Although this may not “seem a lot” in fact 1oc Celsius is a lot.
For example reduce the temperature of you fridge down to 0oc and then place a frozen ice block in it of any size. Time how long that takes to melt at zero degrees then repeat the test but move the dial of the thermostat up and then time how long the ice block takes to melt = 1oc a fast but concerning scientific experimental look into climate change is the conclusive results that one will view over a period of time.
What you have just witnessed is similar to climate change within you fridge. That is no different to the North Pole hence why the England has been pummeled by severe floods for the best part of five years now causing wide spread damage. 2012 September, October, November and December have been the wettest of all months for England and from predictions and scientific analysis it’s only going to get worse.
The ten warmest years on record occurred since 1997 and the most shocking was the sea level rises around the United Kingdom that rose from 1900’s TEN centimeters and another shocking fact that everyone in the United Kingdom has been warned about is If emissions continue to grow at present rates global temperature could rise as much as 7 °C above pre-industrial temperature by 2100”. Should this occur which stark previous evidence has already proved it has from 1900-1970-2010 then the United Kingdom is in danger.
By the 2080s, annual economic damage from flooding in the UK could increase from £1 billion to between £15 billion and £21 billion, it’s anticipated that climate change will increase the likelihood of flooding. Winters are going to become significantly wetter. On the wettest days of the year, this could mean an increase in rainfall of 40 per cent or more by the 2080s.
The most concerning of which we ourselves International Animal Rescue Foundation © have seen in the United Kingdom now on a regular yearly basis is the numbers of properties at high risk of localized flooding from sewer and drainage systems being overwhelmed by sudden localized downpours could typically increase by 2080 four-fold to over 300,000 properties and around 800,000 people. High risk means a 10% chance of flooding in any year.
Many meteorologists have stated that the “East” of the England is more prone to flooding and is going to be under water in the next 100 years. This is not true “to a point” and the main areas that are actually at risk too are the isles of the coast of Scotland and Scotland itself at the tip. The north west of Scotland and mid-lands is much more vulnerable as of “surges” created by the North Sea. The mid-lands will be at much greater risk due to large precipitations and transpiration = localized flooding via rivers.
Tides affect sea levels, but sometimes the weather will also play its part in raising or lowering water height. This is called a surge and is measured by how much higher or lower the sea is than expected on any given tide. A surge is positive if the water level is higher than the expected tide, and negative if lower. Positive surges happen when water is driven towards a coast by wind and negative when it is driven away.
While wind is the main cause of surges, barometric pressure - the pressure in the air - also plays its part. When pressure decreases by one millibar, sea level rises by one centimeter Therefore, a deep depression with a central pressure of about 960 mb causes sea level to rise half a meter above the level it would have been had pressure been about average (1013 mb). When pressure is above average, sea level correspondingly falls. (So in reality the North West of Scotland is by far going to see a heavy damage toll including the isles of Scotland inundated with severe weather and heavy coastal defense losses which cannot be repaired as easy as one thinks).
When strong winds combine with very low pressure they can raise the sea level in eastern England by more than two meters which is serious. Fortunately such surges normally occur at mid-tide levels - so do not cause as much damage. If they were to coincide with high tide it could be a very different story.
Surges travel counter-clockwise around the North Sea - first southwards down the western half of the sea, then northwards up the western side. They take about 24 hours to progress most of the way around.
Waves, generated by strong winds, are another flooding factor. While coastal defenses are designed to deal with high tides, these defenses can be badly damaged by a pounding from large and powerful waves. Some waves are so large that they simply break over coastal defenses sending water flooding in and undermining sea-wall foundations until they collapse. This is what the whole of England has seen for the past five years.
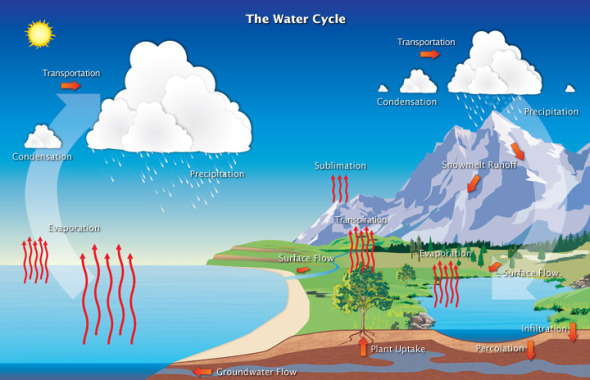
Sadly it gets worse with rain fall, as we all know when there is a warm front moving in and stays present after a low depression then causing more damage inland, although winters are becoming wetter in the United Kingdom it’s also known that freak weather occurrences are happening. For example the summer of 2011 was recorded as the hottest year on record. One would believe that this all good. However when one thinks of “precipitation” a weather pattern that’s best described as a major component of the water cycle, and is responsible for depositing the fresh water on the planet. Approximately 505,000 cubic kilometers (121,000 cu mi) of water falls as precipitation each year. This event mainly happens at sea. Two major issues here 1) precipitation and waterlogged ground 2) precipitation and drought.
Drought and precipitation does not mix well and the ground is so hard that the water cannot penetrate the soil meaning that the ground just acts as a runoff. So making this a little more easy to understand, in a hot spell the transpiration from plants and trees to evaporation from sea’s lakes, and rives = in a hot summer with drought, aggressive flooding consequences.
The ground being so hard and with much evaporation and transpiration = high precipitation. With such solid ground level and the soil not being able to absorb quicker enough then this = rivers being overwhelmed which then = inland flooding instead of “coastal flooding”.
Although both are as bad with the current global temperature predicted to reach another 7oc then inland flooding is going be more severe than any type of coastal flooding as our international rivers will not be able to handle such vast amounts of water as more attention is being focused on “coastal regions to improve sea defenses .
Coastal defenses must take priority of course BUT river defenses need attention to and urgently. Construction and insurance companies must now take more notice of NOT building on flood plains and NOT insuring ANYONE that wishes to construct a building on a flood plain KNOWING that these risks are more than imminent. By adopting this then vast amounts of money will be saved which can then go into protecting inland flooding defenses as well as coastal defenses for the future temperature fluctuations and wetter winters.
The same applies for waterlogged plains or soil of which if there is a prolonged hot weather spell mixed with bouts of on and off rain then the soil will not be able to take the percentage amount of water “run of” and “precipitation” combined with nowhere for the water to go then regrettably any homes within the area of inland rivers or even mountainous regions will then see high river levels again, to landslides = destruction. So our question is 1) why are construction companies still building on flood plains 2) insurance companies insuring these homes 3) inland river defenses not being brought up to scratch.
Other critical factors with regards to this are. there will be more mental-health consequences from repeat flooding. Besides the considerable stress of extensive damage, the threat of repeat flooding, coupled with the possible withdrawal of insurance cover can make properties unsalable and cause long-term depression in the victims.
The socially disadvantaged will be hardest hit. The poor are less able to afford flooding insurance and less able to pay for expensive repairs. People who are ill or who have disabilities will be more vulnerable to the immediate hazard of a flood and to health risks due to polluted flood waters.
To finish of International Animal Rescue Foundation © wishes to now outline the serious and proven risks that we as a human race now have to come to terms with the damages that we have caused as a population of selfish, arrogant and abusive people that are still not willing to make the sacrifices that are needed to “slow” climate change down. It is no longer a question of “how do we stop environmental climatological disruptions” it’s now a question of how does one adapt and become use to the damages that we have as an entire population of 7.8 billion+ people that reside on the planet earth have caused.
Conclusive environmental factual data
- 1880s temperature was recorded by the international metrological office as 13.73-56.71
- 1970s temperature increase to 14.00-57.20 mainly due to the abuse of fossil fuels, the automobile and aircraft being widely used and cheaper with factories burning more than average.
- Even if global temperatures rise by only 1.5 to 2.5 °C it could mean that 20–30% of species could face extinction.
- Globally, the potential for food production is projected to increase with increases in local average temperature over a range of 1-3°C, but above this it is projected to decrease.
- In Africa, by 2020, between 75 million and 250 million people are projected to be exposed to increased water stress due to climate change. In some countries in Africa, yields from rain-fed agriculture could be reduced by up to 50% by 2020.
- Freshwater availability in Central, South, East and South-East Asia, particularly in large river basins, is projected to decrease due to climate change which, along with population growth and increasing demand arising from higher standards of living, could adversely affect more than a billion people by the 2050s.
- In Southern Europe, climate change is projected to worsen conditions (high temperatures and drought) in a region already vulnerable to climate variability, and to reduce water availability, hydropower potential, summer tourism and, in general, crop productivity. It is also projected to increase health risks due to heat waves, and the frequency of wildfires.
- In Northern Europe, climate change is initially projected to bring mixed effects, including some benefits such as reduced demand for heating, increased crop yields and increased forest growth. However, as climate change continues, its negative impacts (including more frequent winter floods, endangered ecosystems and increasing ground instability) are likely to outweigh its benefits.
- At 4°C and above, global food production is likely to be seriously affected.
- Rising sea levels will result in tens to hundreds of millions more people flooded each year with warming of 3 or 4°C. There will be serious risks in South East Asia (Bangladesh and Vietnam), small islands in the Caribbean and the Pacific, and large coastal cities, such as Tokyo, New York, Cairo and London.
- Rising sea levels and other climate-driven changes could drive millions of people to migrate: more than a fifth of Bangladesh could be under water with a 1m rise in sea levels, which is a possibility by the end of the century.
- A 5 or 10% increase in hurricane wind speed, linked to rising sea temperatures, is predicted approximately to double annual damage costs, in the USA.
- In the UK, annual flood losses alone could increase from 0.1% of GDP today to 0.2 - 0.4% of GDP once the increase in global average temperatures reaches 3 or 4°C.
- Heat waves like that experienced in 2003 in Europe, when 35,000 people died and agricultural losses reached $15 billion will be commonplace by the middle of the century.
- At higher temperatures, developed economies face a growing risk of large-scale shocks - for example, the rising costs of extreme weather events could affect global financial markets through higher and more volatile costs of insurance.
- With 5-6°C warming - which is a real possibility for the next century - existing models that include the risk of abrupt and large-scale climate change estimate an average 5-10% loss in global GDP, with poor countries suffering costs in excess of 10% of GDP.
- It’s anticipated that climate change will increase the likelihood of flooding. We expect that winters will get significantly wetter. On the wettest days of the year, this could mean an increase in rainfall of 40 per cent or more by the 2080s.
SINCE WRITING THIS REPORT THERE HAS BEEN OVER 900,000 THOUSAND BABIES BORN THAT’S ONE EVERY FOUR SECONDS AND YET THE GOVERNMENT STATES POPULATION IS DECEASING …..
“ONLY YOU CAN MAKE CHANGE HAPPEN - FAILURE IS NO LONGER AN OPTION”
Dr J C Dimetri V.M.D, B.E.S, Ma, PhD , MEnvSc - [email protected]
http://www.international-animalrescue-foundation.org.uk/